Asian-American Facts Figured
Often referred to as the “model minority,” Asian-Americans from all walks of life and lineage face disparages, in terms of poverty and graduation rates. To say we are a model minority undermines these real problems affecting the community today and further alienates us to politicians who may not understand this large and complex minority.
Below is data gleaned from the White House’s Initiative on Asian Americans and Pacific Islanders and originally compiled by the U.S. Census Bureau from 2008 to 2010. Click on an ethnic group to view its data, and hover over a pie section to learn more about how the AAPI community compares with the rest of America.
- Asian Indian
- Bangladeshi
- Cambodian
- Chinese
- Filipino
- Guamanian or Chammaros
- Hmong
- Indonesian
- Japanese
- Korean
- Laotian
- Micronesian
- Native Hawaiian
- Pakistani
- Polynesian
- Samoan
- Thai
- Vietnamese
Note: Percentages do not add up to 100 percent because some overlap in fields may exist.
As a Korean-American, one of the groups with the least amount of poverty and highest levels of education, I feel privileged and taken aback by the sometimes large fluctuations from group to group. What did you find interesting about this data? How do you think politicians and those in our own community can use this to inspire positive change?
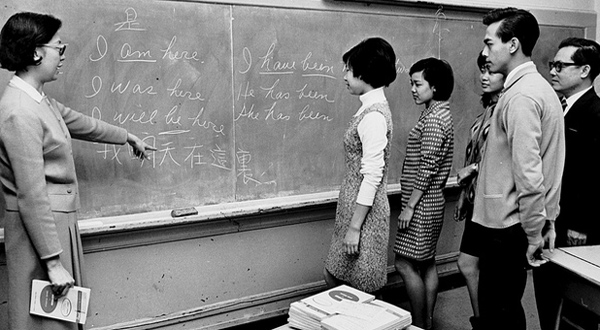
Photo: Cornell University’s Kheel Center Flickr: An English class for Asian American ILGWU members of Local 23-25, December 15, 1968.
Tags: education, facts, Initiative on Asian Americans and Pacific Islanders, poverty, U.S. Census Bureau, White House